 |
Pasadena - November 24, 1999 - 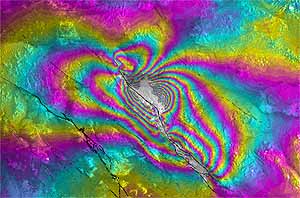 New spaceborne radar data of California's October 16 7.1 magnitude earthquake near the desert town of Twentynine Palms show ground movement with millimeter precision four days after the temblor.
The new radar measurements combine two images taken by the European Space Agency's European Remote Sensing-2 satellite on September 15, about one month before the quake, and October 20, four days after the quake. Caption: The image is an interferometric map of the Hector Mine earthquake area showing the ground displacement along the radar line of sight. One full color cycle represents 10 cm of range displacement. Gray areas are zones of low phase coherence that have been masked before unwrapping. Dotted lines depict California faults, after Jennings (1975), and thick, solid lines the Landers , 1992 surface rupture, after Sieh et al. (1993). Thin, solid lines within zone of dense fringes are surface breaks inferred from azimuth and range disparities (offsets) between before and after images, and phase discontinuities. The topographic phase has been removed using a combination of the USGS 30 m and 90 m digital elevation maps. The rapid orbits from the ESA D-PAF were used to determine the interferometric baseline and to flatten the map. A small phase ramp was removed manually to minimize the far field displacement. Processing from RAW data to interferogram and geocoded map was done using the JPL/Caltech ROI_PAC software package. Desktop Version 109K Overall, the image shows a complex pattern of displacements that provides new insights into the mechanisms of the earthquake, which fractured the region's Lavic Lake fault. Scientists refer to the event as the Hector Mine earthquake. Each color is a contour of measurable ground displacement and the amount of displacement between successive contours of the same color is 10 centimeters (4 inches). Taken from space at a 23-degree angle, the contours can be counted to indicate that the ground moved as much as 5 meters (17 feet) near the fault. The technique of combining images from spaceborne radar instruments to discern elevation and surface change is called synthetic aperture radar interferometry. This scientific tool is quickly becoming a standard method for studying active tectonics and other natural processes both on Earth and on other planets and moons. Synthetic aperture radar interferometry allows seismologists and geophysicists to study regions of a planet with unprecedented precision and resolution over days, months and years, and to monitor processes such as volcanoes, glacier flows and landslides. The European Remote Sensing-2 satellite is managed by the European Space Agency headquartered in Paris, France. Radar analysis was carried out by JPL's imaging radar group for NASA's Earth Science Enterprise program
Email This Article Comment On This Article Related Links Space
 Calcutta, India (SPX) Dec 28, 2005
The successful launch Thursday of India's heaviest satellite from spaceport of Kourou in French Guyana may have boosted the country's space research efforts to yet another level, but it has also lifted the spirits of at least three Direct-To-Home televisions broadcasters, one of which has been waiting for years to launch its services in India. |
|
|
|
|
|
|
|
|
|
|
|
|
|
| The content herein, unless otherwise known to be public domain, are Copyright 1995-2006 - SpaceDaily.AFP and UPI Wire Stories are copyright Agence France-Presse and United Press International. ESA PortalReports are copyright European Space Agency. All NASA sourced material is public domain. Additionalcopyrights may apply in whole or part to other bona fide parties. Advertising does not imply endorsement,agreement or approval of any opinions, statements or information provided by SpaceDaily on any Web page published or hosted by SpaceDaily. Privacy Statement |
