 |
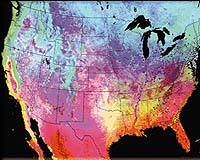
Greenbelt - Feb 5, 2002 A NASA-funded study uses temperature and vegetation data from satellites to help track and predict where West Nile Virus is spreading in North America. Scientists and public health officials hope one day to use near real-time maps to focus resources and stave off the disease more efficiently. The disease, first reported in the U.S. in 1999, causes flu-like symptoms that can lead to fatal encephalitis in people with compromised immune systems, like the elderly. Though not yet proven, scientists believe the West Nile Virus may be spread across the country by infected birds traveling along their migration routes. Mosquitoes that act as a vector carry the virus, and pass it on when feeding on hosts like birds, livestock, other animals and people. The satellite maps show nation-wide temperatures, distributions of vegetation, bird migration routes and areas pinpointing reported cases. The combined data helps scientists predict disease outbreaks by showing where conditions are right for the insects to thrive and where the disease appears to be spreading. "The images are derived from satellite data that capture a number of variables that are crucial for detecting whether a habitat is suitable for a vector, like a mosquito that carries West Nile Virus," said David Rogers, the lead author of the study. Rogers is Professor of Ecology at Oxford University in the United Kingdom and a member of the International Research Partnership for Infectious Diseases (INTREPID) group, based at NASA's Goddard Space Flight Center. This paper is the cover story in the most recent issue of Photogrammatic Engineering and Remote Sensing. "It's not a single variable that tends to determine whether a disease will occur, but rather a combination of variables," Rogers said. Satellite sensors, like the National Oceanic and Atmospheric Administration's Advanced Very High Resolution Radiometer (AVHRR), provide information on vegetation and peak and average annual temperatures. Mosquito populations are constrained by different factors in different places. In the North, colder temperatures hold mosquito populations back. In the south, where temperatures are higher, the insects are more dependent on the availability of moisture for survival. Lush vegetation provides a good indicator of areas with increased levels of moisture. Mosquitoes tend to thrive in warmer, wetter areas. Satellites let researchers see which areas have these conditions, allowing for better prediction of disease transmission. Similarly, satellites also help plot patterns like the timing of when temperatures peak during a year. Mosquito populations appear to increase during the first half of the year but only reach sufficient levels to transmit the disease during the second half of each year. "The timing of a seasonal peak of temperatures determines the increase of vector populations in that place," said Rogers. "An early rise in spring temperature is likely to get the mosquito off to a flying start." The idea is to let the satellite capture where the disease is spreading from year to year and make some predictions about where the disease is going. Computer models can determine which areas have the right combinations of temperatures and moisture levels most suitable for mosquitoes and transmission. Then, efforts and resources can target those high-risk areas. The study suggests that a mild winter in 1998 to 1999 may have provided favorable conditions for mosquitoes to survive the winter, leading to a greater number of carriers in 1999. In that first year reported cases were found in three states. The number grew to 12 states in 2000, and more than 20 in 2001, despite the fact that the winters preceding these years were either average or slightly below average. "Once a disease like West Nile Virus establishes a foothold, and spreads, it will be very difficult to eradicate," said Rogers. The methods used in this research may be modified and applied to study a variety of other diseases like malaria, dengue fever, Lyme disease, influenza and even asthma. Community Email This Article Comment On This Article Related Links Goddard SpaceDaily Search SpaceDaily Subscribe To SpaceDaily Express Dirt, rocks and all the stuff we stand on firmly
 Paris (ESA) Jan 12, 2006
Using the ESA Cluster spacecraft and the NASA Wind and ACE satellites, a team of American and European scientists have discovered the largest jets of particles created between the Earth and the Sun by magnetic reconnection. This result makes the cover of this week's issue of Nature. |
|
| The content herein, unless otherwise known to be public domain, are Copyright 1995-2006 - SpaceDaily.AFP and UPI Wire Stories are copyright Agence France-Presse and United Press International. ESA PortalReports are copyright European Space Agency. All NASA sourced material is public domain. Additionalcopyrights may apply in whole or part to other bona fide parties. Advertising does not imply endorsement,agreement or approval of any opinions, statements or information provided by SpaceDaily on any Web page published or hosted by SpaceDaily. Privacy Statement |