 |
Greenbelt - Apr 03, 2002 A new NASA computer model can now tell exactly where in the world rain or snow that provides local water originated. Scientists can use this "water vapor tracer" to improve rainfall and drought forecasts and gain a deeper understanding of climate change. The model simulates water movement in the atmosphere around the world, and traces it from the places where it evaporates to the places where it falls back to Earth. "If I see rain or snow in the central U.S., I can now tell you how much of the moisture came from the Gulf of Mexico, how much came from the tropical Atlantic Ocean and so on," said meteorologist Mike Bosilovich of NASA's Data Assimilation Office at Goddard Space Flight Center in Greenbelt, Md. Bosilovich is lead author of the study being published in the March-April issue of the Journal of Hydrometeorology. "The model gives us a much clearer picture of how water moves in the atmosphere than we have ever had before." By identifying water vapor movement in the atmosphere, weather forecasters will better understand how evaporation from a particular place contributes to local and regional precipitation, leading to more accurate weather forecasts. The model can actually pinpoint individual regional sources of atmospheric moisture, rather than combining them. Bosilovich said if scientists can understand how geographic sources of atmospheric moisture fluctuate from year to year, they also will have a clearer picture of how climate changes in the long term. The atmosphere over North America receives moisture evaporated from many different water sources. For example, while clouds above the West Coast generally originate in the Pacific Ocean, those over the Midwest are more likely to have come from the Gulf of Mexico. Water from previous storms also evaporates from the land, contributing to the mix. "You might visualize each region of a continent or ocean as having a kind of 'smokestack,'" Bosilovich explained. "Each 'smokestack' sends up a plume of water vapor that mixes with the air." But what complicates matters is that these "smokestacks" send up different-sized plumes of moisture at different times, and changes in wind and temperature can push them in different directions depending on the day or season. Until very recently, even the fastest computers had trouble keeping track of all the variables. Bosilovich and Siegfried Schubert, who works with Bosilovich, have demonstrated the model's capabilities by analyzing the atmospheric water cycles over India and North America. They chose to analyze the cycles during the summer months over a period of six years, since both regions experience monsoons from June through August, and provide a great deal of moisture to track. They found that while precipitation in India often comes directly from the ocean, much of what falls on the United States in the summertime can be "recycled" moisture -- water from previous storms that evaporates from the ground and then falls again quickly nearby. "The model could assess how strongly this recycling of water contributed to floods like the devastating Mississippi River flood of 1993," Bosilovich said. Bosilovich is currently applying the data from the 1993 flood to the water-vapor tracer model, to gain a better insight into the processes that generated the flood. Analyzing past weather events will help him refine his model's operation, a necessity if it is ever to make accurate predictions of future weather. "Currently, the only hard data the model accounts for is sea surface temperature; everything else is simulated. Our next big job is to work more observational data into the model, so it can reflect actual global atmospheric conditions," said Bosilovich. Such improvements will take time, but could lead scientists to better understanding of both next week's weather and the next century's climate. Community Email This Article Comment On This Article Related Links EOS Project Science Office SpaceDaily SpaceDaily Search SpaceDaily Subscribe To SpaceDaily Express Dirt, rocks and all the stuff we stand on firmly
 Paris (ESA) Jan 12, 2006
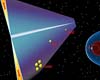
Using the ESA Cluster spacecraft and the NASA Wind and ACE satellites, a team of American and European scientists have discovered the largest jets of particles created between the Earth and the Sun by magnetic reconnection. This result makes the cover of this week's issue of Nature. |
|
| The content herein, unless otherwise known to be public domain, are Copyright 1995-2006 - SpaceDaily.AFP and UPI Wire Stories are copyright Agence France-Presse and United Press International. ESA PortalReports are copyright European Space Agency. All NASA sourced material is public domain. Additionalcopyrights may apply in whole or part to other bona fide parties. Advertising does not imply endorsement,agreement or approval of any opinions, statements or information provided by SpaceDaily on any Web page published or hosted by SpaceDaily. Privacy Statement |
